As investors in multifamily real estate assets, migration patterns matter to us. Where the population is moving is one of the most important factors we look at in choosing markets in which to invest. Sidenote: for the other factors we look at when choosing markets, check out a piece we put out on this very subject HERE. While it will likely be months or even years before we find out all of the lasting effects of this pandemic, we can make some early observations as to how coronavirus has impacted Americans’ migration patterns thus far. First, let’s examine why they’re moving:
Americans Are Working Differently
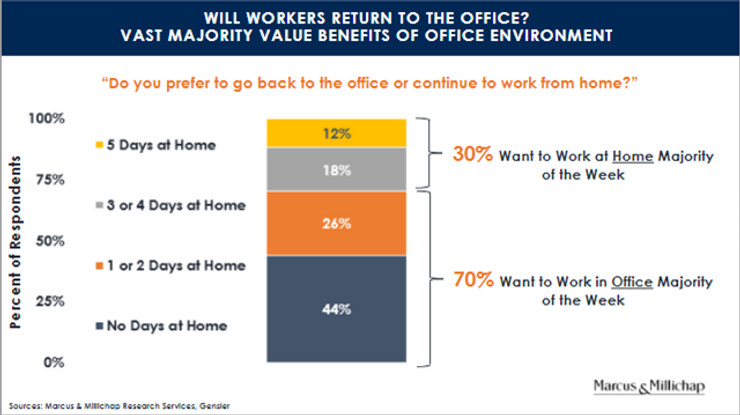
Coronavirus has upended the traditional office model and pushed many industries toward large scale adoption of work from home (WFH) arrangements—chart 1 below shows that this WFH preference may be here to stay long after COVID-19. A full 56% of respondents prefer to WFH at least part of the time. The WFH model is especially suited to white collar, generally higher wage industries such as technology, financial services, consulting, and insurance verticals.
Chart 1
WFH Makes Cities Less Appealing
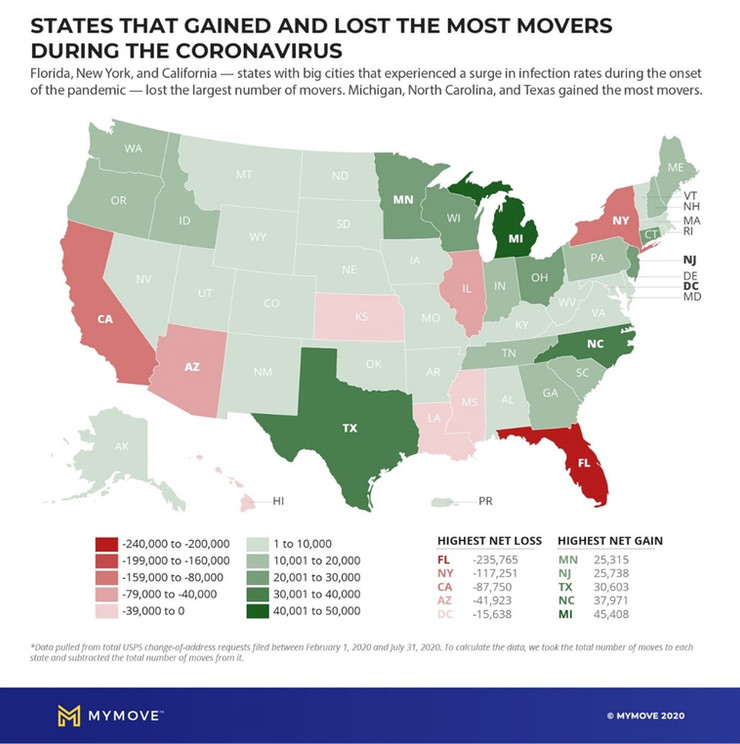
As a result of this WFH trend as well as shutdowns of many cultural centers, the allure of major cities is starting to wear off for some newly-remote workers. In fact, according to a new survey from online freelance company Upwork Inc., up to 23 million Americans plan to relocate to a new city as a result of the coronavirus. This represents more than 11% of households surveyed, implying that US migration rates will be 3-4x what they are during normal times. As one might expect, in the below charts 2, 3, & 4 we see that coronavirus has prompted a migration from densely-populated cities and into smaller, less crowded, and cheaper locales. According to the below chart 3, six in ten of the cities with the highest net gain of movers during COVID-19 were in Texas. The Lone Star State is a natural choice for COVID movers as it has a lower cost of living, a variety of smaller towns, and plenty of open space. In addition to Texas, Michigan and North Carolina round out the top 3 net gainer states—see chart 5. Not surprisingly, New Jersey and Connecticut have so far benefitted from the exodus in the 5 boroughs.
Chart 2
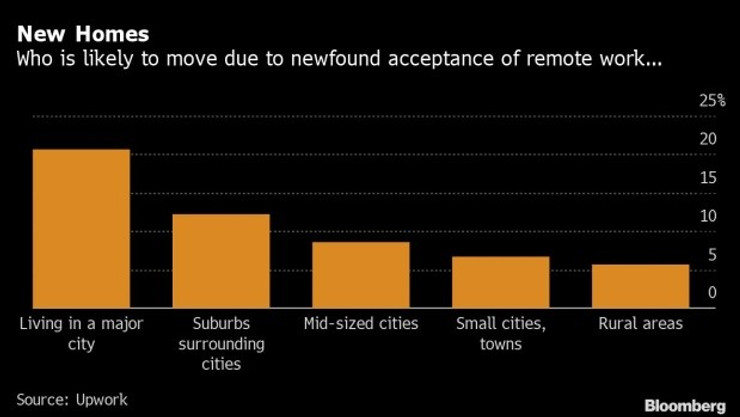
Chart 3
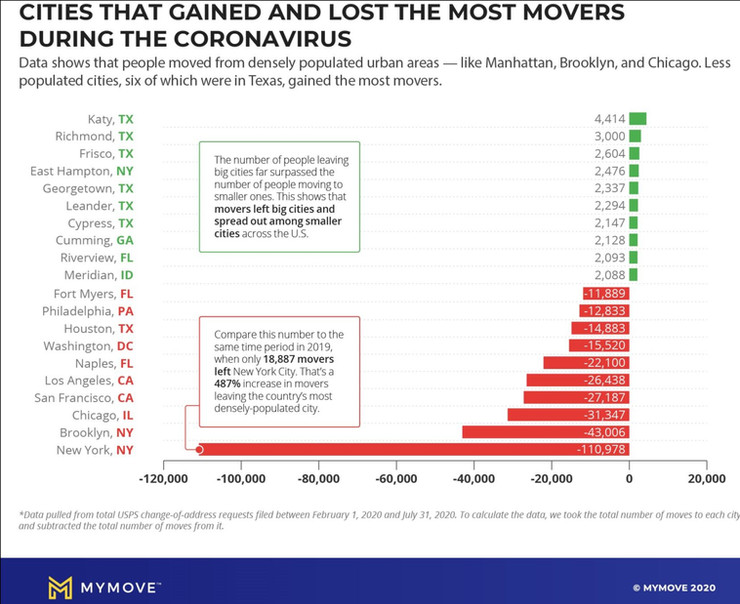
Chart 4
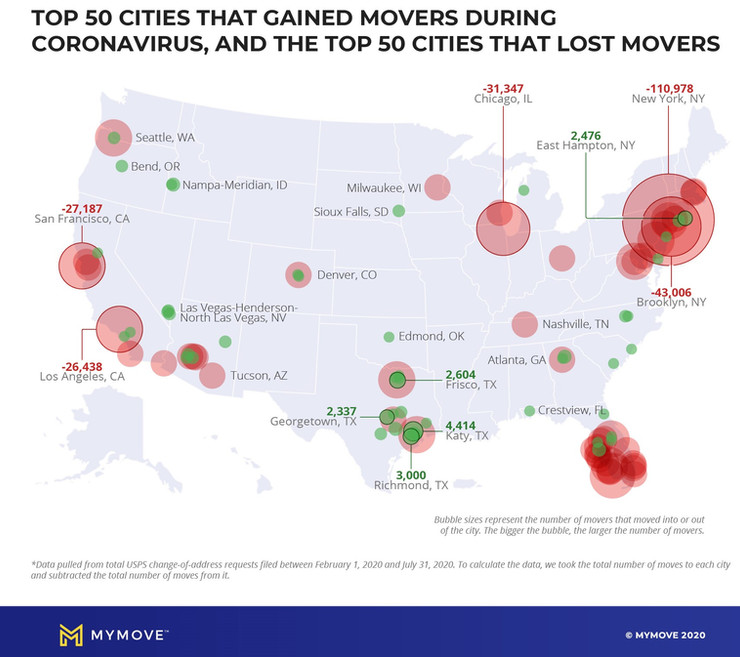
Chart 5
Which Is Pushing Residential Suburban Prices Higher
This flight to suburban and ex-urban markets has resulted in a rush for single-family housing across the country. In September for example, existing properties were on the market for 21 days on average, an all-time low. Record-low mortgage rates have also helped a bit there as they have made purchasing the average-priced home the most affordable it’s been since 2016. This soaring demand combined with cheap borrowing costs has pushed prices to a record high. As a result, inventory has plunged, foreshadowing stronger residential construction through at least early 2021.
…But It’s Not All Rainbows And Sunshine
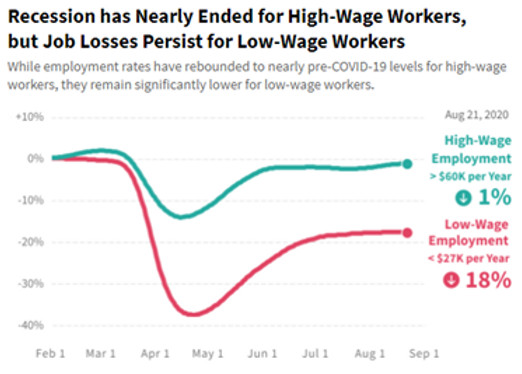
While the above-mentioned demographic (highly educated, high-income, white collar workers) have been able to shift to WFH, relocate, and maintain jobs, those options aren’t on the table for many at the lower rungs of the socio-economic ladder. Indeed, lower-wage service industry workers have suffered the most during this recession. For example, at the height of the coronavirus crisis, low-wage jobs were lost at about eight times the rate of high-wage ones according to a Washington Post analysis of job losses across the income spectrum (see below chart 6). Their analysis concluded that the less workers earned at their job, the more likely they were to lose it as businesses across the country closed. It’s for this reason that wealth gaps in the US have widened so dramatically during this pandemic, which the Post called “the most unequal recession in modern U.S. history.” Ben Bernanke, former Chairman of the Federal Reserve and the man who led the response to the Great Recession, describes it as “an even more unequal recession than usual. The sectors most deeply affected by COVID disproportionately employ women, minorities and lower-income workers.” These hardest hit sectors include leisure & hospitality, restaurants, oil & gas, retail, and entertainment. They’ve also been the slowest industries/jobs to come back as social distancing precautions have made it impossible to run many of these businesses at full capacity (see below chart 7).
Chart 6
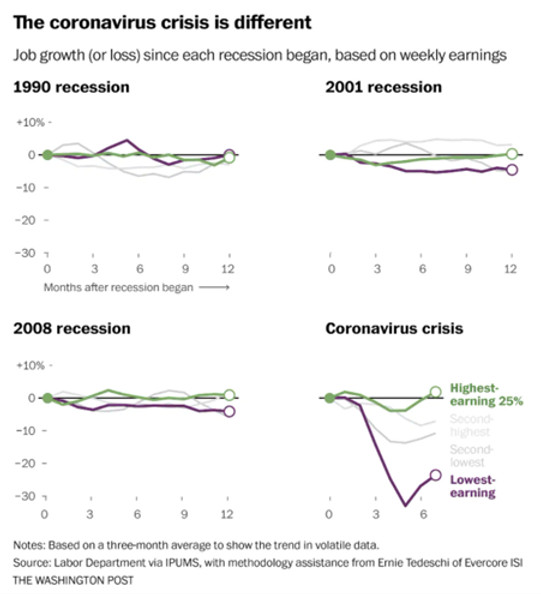
Chart 7
Why does that trend matter to us as real estate investors? Simply put, these are our customers. A large proportion of those suffering the economic effects of COVID most severely are our renters. Renters tend to be less financially secure (both income and wealth-wise) vs. their homeowner counterparts, and tend to have less saved to withstand downturns. In fact, 10% of renters nationwide reported “no confidence” in their ability to pay next month’s rent, according to a U.S. Census Bureau survey conducted Sept. 2 to 14. That means that unless further stimulus is enacted by Congress, and that’s highly unlikely in the lame duck session until inauguration, many lower wage tenants will continue to struggle in the months to come.
It’s going to be up to us and our property management partners to find workable solutions for the issues our tenants face. But it all comes back to one thing that truly great operators do already: communicate early and often with those they serve (investors and tenants alike). Sitting back and waiting for rent collections and bad debt to come in is a loser’s strategy in these dynamic times. This is an opportunity; it’s a time for superstar operators to outperform the competition through client service and asset management. We as operators/investors have to be proactive in dealing with these issues. Let’s all rise to the occasion. We owe it to our tenants and to our investors.